on
NUFORC UFO sighting reports, Part II: Exploratory Data visualisations
National UFO Reporting Centre was founded in 1974 and have been active in collecting reports of UFO sightings through hotline and online forms to this day. NUFORC provides data of reports they receive online. The particular dataset I use was obtained here. The reports in this dataset were collected up till August of 2017. People wishing to report a sighting may call the Center’s hotline (only for sightings occuring within a week), a web form is available for other reports.
Allow me to preface this by saying … I intentionally did this exclusively in Python because while I am equally comfortable with both, I worked with R exclusively for a lot of my bioinformatics projects, and have never resisted dabbling into ggplot2 when I use Python. Until now. This is to demonstrate that I can do both, and subsequently, ggplot2 is still so much better. All visualizations produced with Seaborn and Matplotlib packages (Matplotlib’s basemap module was used to generate maps).
UFO reports over time
Reports of UFO sightings increased dramatically around 1950’s, and continued increasing until 2014, with decreases observed between then and 2016. Data collection for 2017 is not complete (up to August 24th) at the time this dataset was scraped, therefore, the 2017 year is not included in the second plot.
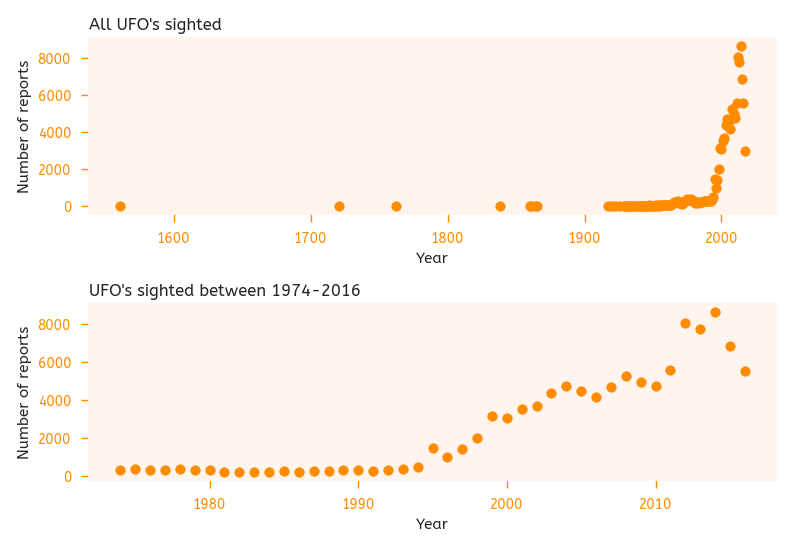
Interestingly, despite NUFORC being founded in 1974, the earliest UFO sighting in the data was on 1561-04-14, reported on 2012-08-09:
I would think that Hanz Glaser had better things to do than spend months on a wood carving that was too ugly to sell. It’s a map. A very accurate one for its day. If there were to be hard evidence on earth it would be behind the old church in the carving. Look at the picture…maybe more than one ship. It might be a very interesting dig. ((NUFORC Note: Witness elects to provide no contact information. PD))
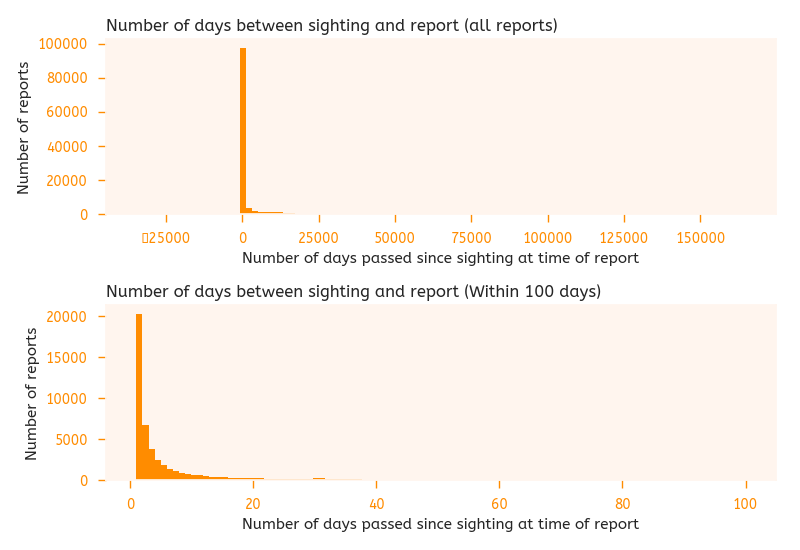
So it’s not an eye witness account. In fact, there is exactly 514379 days between the time of the “sighting” and the report. This is an exception to the rule, as most reports were made within days of the sighting:
Some quick numbers (yes, I could’ve made a function for this).
# reports made before the actual sighting
>>> condition = sum(ufo["date_difference"] < 0)
>>> print(f" {condition} or {100*condition/ufo.shape[0]}% of reports were made prior to the sighting!")
 2253 or 2.009902315000669% of reports were made prior to the sighting!

# reports made within a week after the sighting
>>> condition = sum((ufo['date_difference'] < 7) & (ufo['date_difference'] >= 0))
>>> print(f" {condition} or {100*condition/ufo.shape[0]}% of reports were made within a week of a sighting.")
 73166 or 65.27142156206789% of reports were made within a week of a sighting.

# reports made on the same day
>>> condition = sum(ufo["date_difference"] == 0)
>>> print(f" {condition} or {100*condition/ufo.shape[0]}% of reports were made on the same day of the sighting.")
 36539 or 32.596458361211475% of reports were made on the same day of the sighting.
UFO reports by location
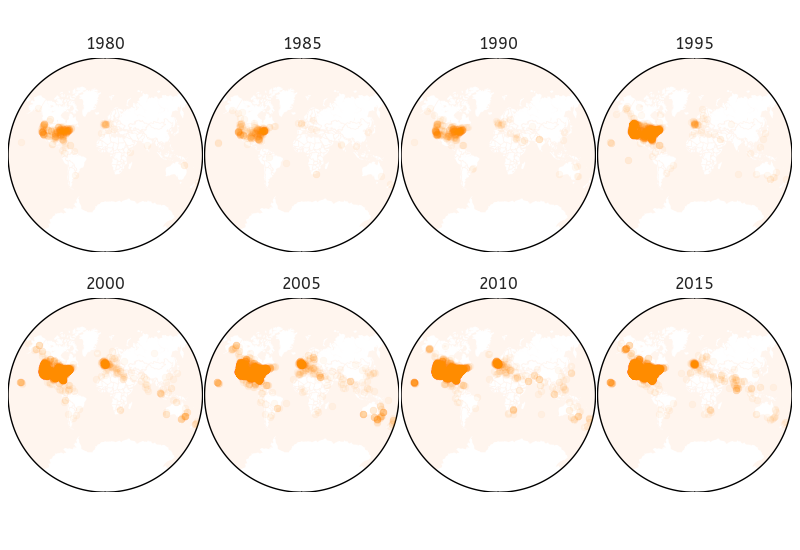
Although NUFORC is a national service, it does receive reports from all over the world, as evidenced in the dataset. Over time, reports become more numerous, both within the US and internationally.
UFO reports by shapes
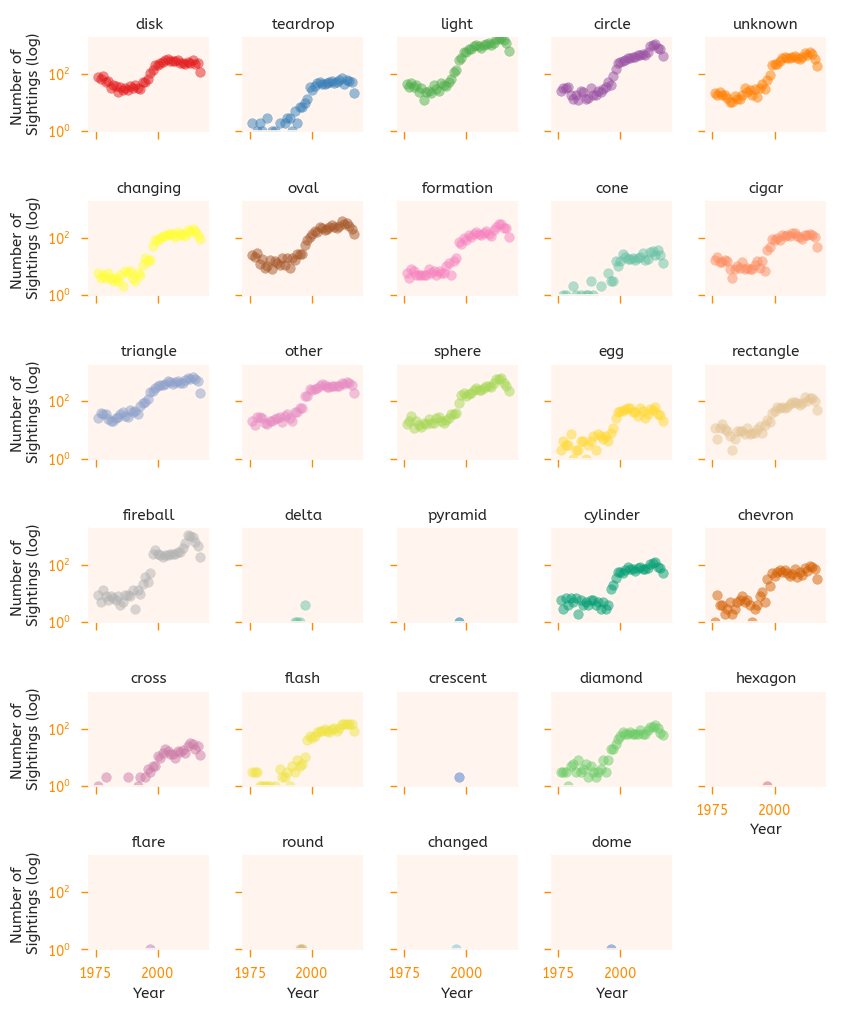
For each report, a shape is assigned to the UFO sighted. Some shapes are more popular than others. The following figure shows the number of reports of each shape over time between 1974 and 2016 (since founding of NUFORC). Note the log scale in the y-axis. Some shapes, such as delta, pyramid, crescent, round, flare, dome, changed (which may be the same as changing, but left as is because I’m not sure), were introduced fairly recently.
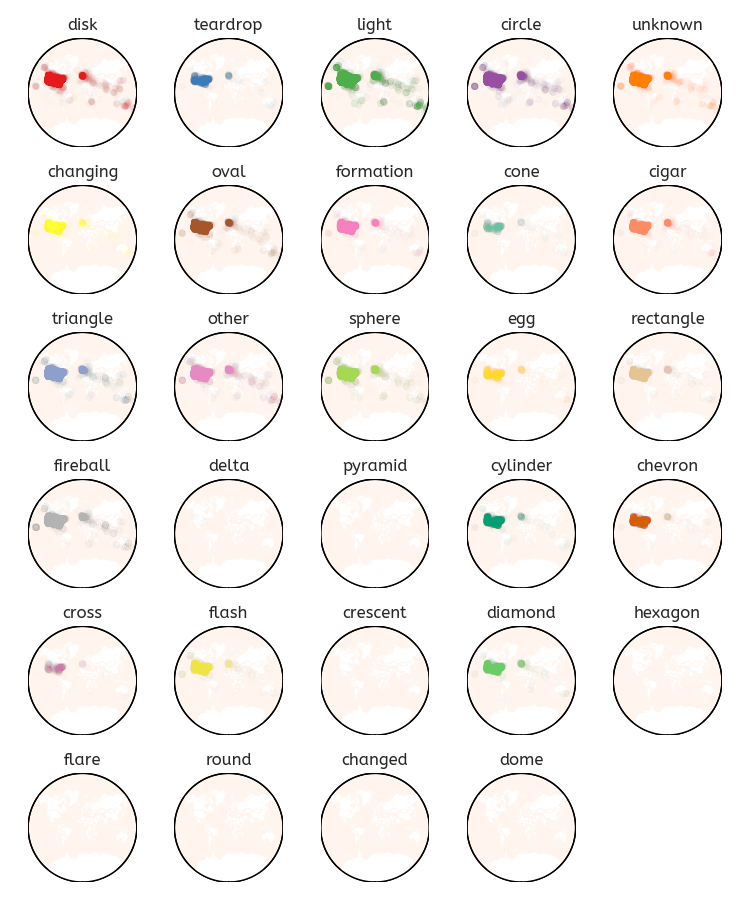
When we look at the distribution of sightings by shape, there isn’t a clear pattern of UFO of different shapes favouring different regions.
That’s it for now. This has been mostly exploratory, I’ll be doing more detailed analysis next, including text analysis of the actual reports.